USDJPY Head & Shoulders Pattern Forming At Key Weekly Resistance Area 110.96 To 111.71

- Duncan Cooper , Senior Market Strategist & Trading Mentor at ACY Securities
- 13.07.2021 05:15 pm trading
Overview:
Watch the video for a summary of this week’s news releases, and a complete Top Down Analysis of the USDJPY.
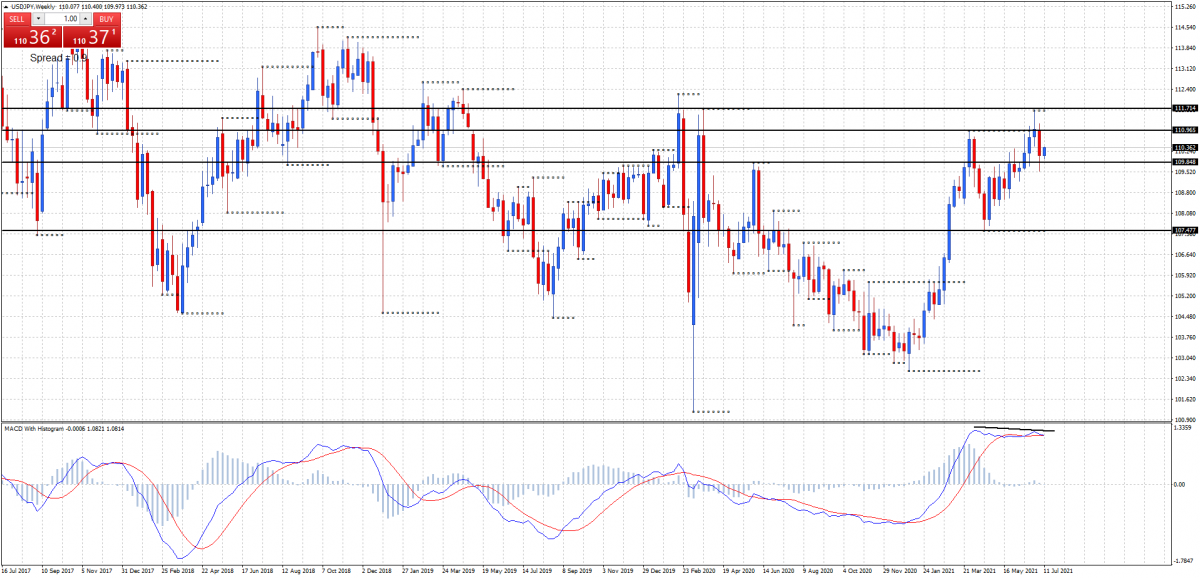
USDJPY Weekly:
Weekly support at 109.84 and 107.47, resistance at 110.96 and 111.71.
Price has failed at the 110.96 and 111.71 weekly resistance highs. MACD is almost showing negative divergence signalling a potential change in trend at a strong resistance area.
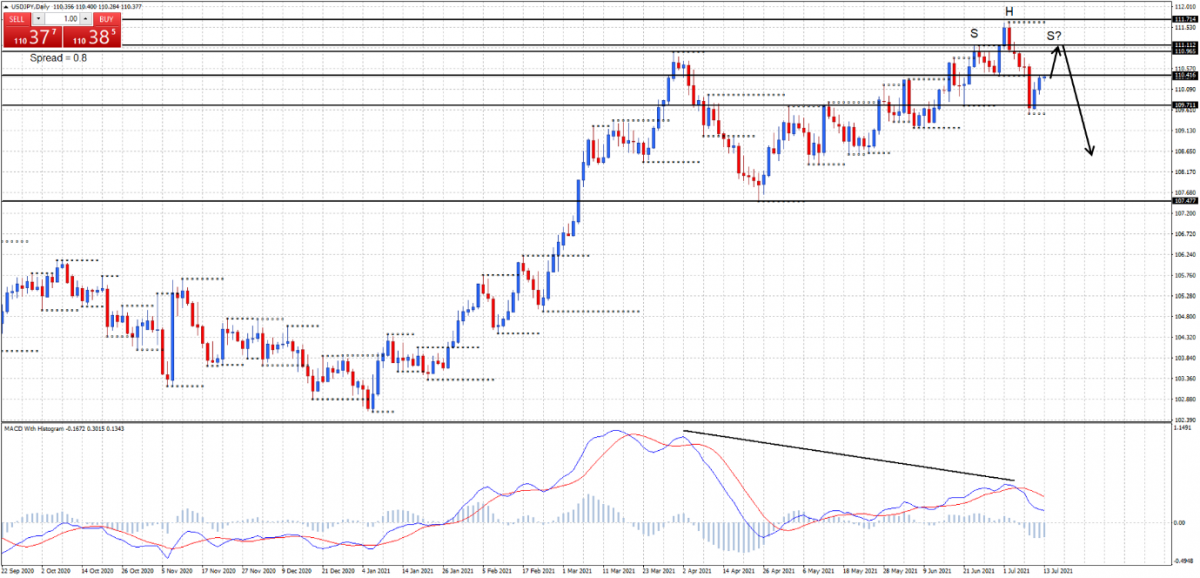
USDJPY Daily:
Daily support at 109.71, resistance at 110.41 and 111.11.
Price has turned down on the daily chart showing a lower bottom. MACD is showing negative divergence.
A head and shoulders pattern may form if price rallies back to the 111.00 resistance area. A failure at the 111.00 resistance area would present an ideal opportunity to sell for the next decline in line with the current downtrend.