S&P Global Market Intelligence Analyses Bank Efficiency Worldwide

  • Banking
  • 07.04.2016 01:00 pm

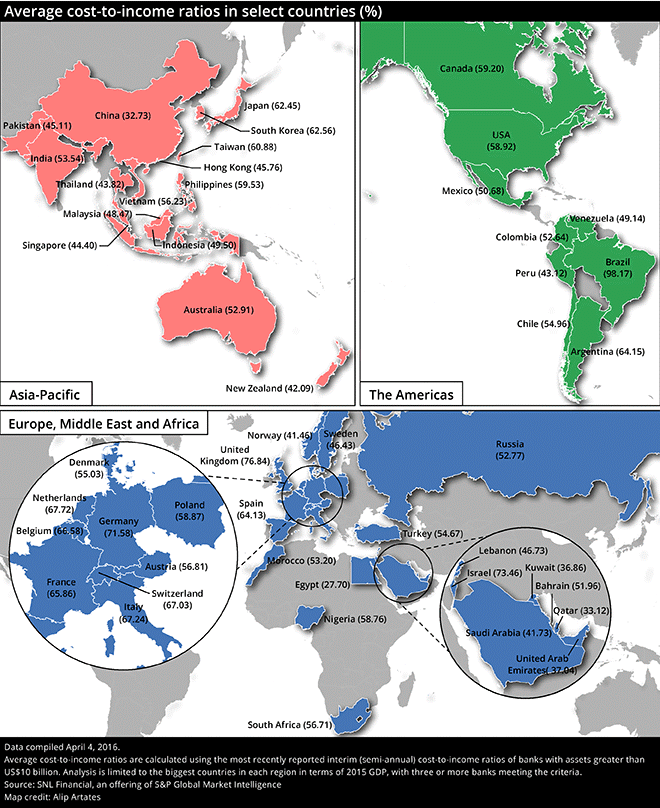
With many of the world's banks having reported results for the period ended Dec. 31, 2015, S&P Global Market Intelligence took a bird's-eye view of bank efficiency around the world by looking at cost-to-income ratios for institutions with at least US$10 billion in assets.

The ratio, which measures operating expense as a percentage of operating income, is used to gauge efficiency and productivity for banks. Lower ratios generally indicate higher efficiency, but a number of factors can affect the ratio, including a bank's business model and size. For example, as the Reserve Bank of Australia noted in its September 2014 Financial Stability Review, banks that focus on commercial banking and generate a greater share of their income from interest income "tended to have lower [cost-to-income] ratios than 'universal' banks, which earned a larger share of their income through non-interest sources such as investment banking or wealth management."

When looking at banks across countries and regions, it is important to highlight that the economic, financial and regulatory environment of each country can affect cost-to-income ratios. Banks around the world also report financial results for a given period on different timelines, sometimes with fiscal year-ends that do not correspond to the calendar year-end. S&P Global Market Intelligence used data available for each bank for the most recent six-month period ending in 2015. Therefore, while the results included in this analysis do not perfectly line up in terms of time periods reported, they offer insight into the performance of banks in the 2015 calendar year.

According to data available as of March 23, banks in Egypt, on average, were the most efficient. Of the countries with at least three banks included in the S&P Global Market Intelligence analysis, Egypt posted the lowest average cost-to-income ratio at 27.70%. Of the four Egyptian banks included in the analysis, two had ratios for the six months ended Dec. 31, while the other two had ratios for the six months ended June 30, 2015.

Chinese banks had an average ratio of 32.73%. Banks in Qatar, Kuwait and the United Arab Emirates posted average ratios of 33.12%, 36.86% and 37.04%, respectively.

On the other end of the spectrum, banks in Brazil were the least efficient in the analysis, with an average cost-to-income ratio of 98.17%. Banks in the U.K. recorded an average cost-to-income ratio of 76.84%, while those in Israel had an average ratio of 73.46%. Banks in Germany posted an average cost-to-income ratio of 71.56%, and those in the Netherlands came in at 67.72%. Most banks in these countries have reported results for the period ended Dec. 31.

Among the 15 largest banks in North America, Capital One Financial Corp. was the most efficient with a cost-to-income ratio of 53.29%, while Morgan Stanley had the highest ratio at 79.99%. S&P Global Market Intelligence used the cost-to-income ratio for consistency across regions; however banks in North America typically use another metric, known as the efficiency ratio, to calculate efficiency. This widely known ratio is defined as noninterest expense before foreclosed property expense, amortization of intangibles, and goodwill impairments as a percentage of net interest income and noninterest revenues, excluding gains from securities transactions and nonrecurring items.

Of the 15 largest Latin American banks, Banco De Venezuela SA Banco Universal had the lowest ratio at 16.77%, while Banco Santander (Brasil) SA, a unit of Spain's Banco Santander SA, had the highest ratio at 109.06%.

While its Brazilian unit posted the highest cost-to-income ratio among the largest Latin American banks, Banco Santander was the most efficient of the 15 largest banks in Europe with a ratio of 55.96%. U.K.-based Royal Bank of Scotland Group Plc's cost-to-income ratio of 155.44% was the highest among the largest banks in Europe.

In Africa, Nigerian banks showed a wide range of cost-to-income ratios. Of the 15 largest banks on the continent, Nigeria's Guaranty Trust Bank Plc had the lowest ratio at 42.48%, while the country's United Bank for Africa Plc came in at 67.50%.

Among the 15 largest Middle Eastern banks, the UAE's First Gulf Bank PJSC posted a ratio of 17.30%, and Israel Discount Bank Ltd. came in at 77.52%.

In the Asia-Pacific region, where many large banks have yet to report results for the Dec. 31 period or report in other six-month periods, China's Shanghai Pudong Development Bank Co. Ltd. had the lowest cost-to income ratio among the 15 largest banks at 20.76%; the figure represents the semi-annual ratio at June 30, 2015. Japan's Mitsubishi UFJ Financial Group Inc. posted the largest ratio at 57.37%; the company's most recent semi-annual ratio is as of Sept. 30, 2015.

The full report can be accessed here.

Related News