Database Monitoring And Security Go Hand in Hand

- Denham Cherry , Principal Consultant at Denny Cherry & Associates Consulting
- 25.12.2025 11:30 am #DatabaseMonitoring #DataSecurity
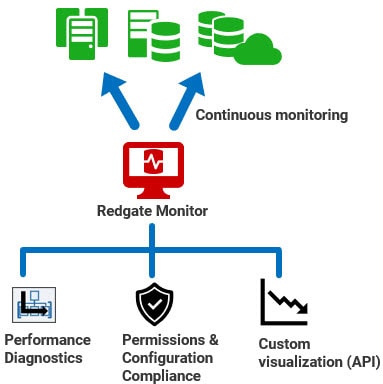
A comprehensive strategy for monitoring your database estate should go beyond performance metrics like CPU usage, memory consumption, and IO performance. This article explains a unified approach using Redgate Monitor, which will collect performance and security data side by side across all databases and servers, whether on-premises, cloud-hosted, or both. It highlights security features for monitoring and reviewing the configuration of your database and servers, as well as tracking which users and processes have access to them, and with what permissions. It also explores features for maintaining continuous availability of monitoring data, and enabling custom visualization and reporting based on historical monitoring data.
Security and performance monitoring through a single pane of glass
Tracking database performance and security data side-by-side reveals variations in query performance, resource usage and user activity right alongside any suspicious permission changes or unauthorized configuration drift.
You will often see correlations that can lead to faster diagnosis and mitigation of risk. For example, a sudden spike in activity on sensitive data tables might coincide with an unauthorized permission escalation. Alternatively, a sudden increase in query execution times on a SQL Server instance might correlate with configuration drift for the max degree of parallelism (MAXDOP) setting.
This article will explore the features of Redgate Monitor Enterprise that will allow DBAs to:
- Ensure security and compliance with Microsoft SQL Server configuration monitoring
- Streamline the compliance and audit process with standardized templates that can be easily exported and shared
- Monitor user roles and permissions to ensure compliance and security
- Ensure high availability configuration so that Redgate Monitor is always running
- Utilize extensibility options to connect your monitoring data with other applications
Monitoring of Microsoft SQL Server configuration
Redgate Monitor Enterprise’s configuration compliance feature provides DBAs with a comprehensive view of key instance and database settings, automatically tracking configurations that impact both security and performance.
For example, the company’s configuration policies might include disabling xp_cmdshell by default, while an attacker would turn it on so they can download and install software from the command line. Catching unauthorized changes to this and other security settings might be your first indication that an attack is happening. Similarly, spotting quickly that auto_update_statistics has been disabled on a busy database might help you avoid query performance issues before they occur.
Without a monitoring solution, it’s nearly impossible to know what has been changed or why, whether by a system administrator or a threat actor. By automatically tracking both performance and security configurations, Redgate Monitor can help ensure a secure, standardized environment while maintaining optimal database performance.
Compliance and auditing templates
Going through an audit can be daunting for any IT team. By centrally managing database security monitoring, Redgate Monitor Enterprise makes auditing reviews easier, quicker and simpler to complete, because the information your auditor needs is in one place.
DBAs can audit current configuration settings against predefined compliance templates that reflect organizational standards or the requirements of a particular set of industry regulations, or a ‘gold standard’ benchmark such as the CIS (Center for Internet Security) Benchmark for SQL Server 2022.
These templates will allow DBAs to identify and investigate configuration deviations speedily. They will also verify for an auditor that all instances and databases are configured in compliance with relevant standards and regulations. If needed, you can adapt or create your own compliance template which has the workload settings which are important to your organization and to your auditor.
When audit season comes around DBAs can simply export the report that demonstrates compliance with the regulatory template and give that report to the auditor, along with the definition of the template. If additional requirements arise, they can extend the template to capture the new metrics, and Redgate Monitor will gather and analyze the additional data automatically.
Monitoring SQL Server user roles and permissions
The volume of access requests on a database server will fluctuate depending on user behavior, server workload schedules, and many other factors. However, the security footprint of a server, such as role memberships and permission assignments, should remain stable unless changes are explicitly authorized by a security administrator.
Redgate Monitor Enterprise’s permissions features enable DBAs to track, by server, database, or user, exactly who has access to what. It monitors membership of powerful fixed server roles, Windows logins and groups, as well as the granular permissions assigned to individual database users. You can also view, filter and export the status and history of the user permissions on the system.
Changes in the membership of a fixed server role, for example, can indicate unauthorized activity. In the 2024 cyber-attack against Microsoft by Midnight Blizzard, attackers created a Windows account to infiltrate the corporate environment and access target devices. By automatically tracking changes to fixed server role memberships, Redgate Monitor can provide an early warning of such threats. Similarly, by closely monitoring Windows login and group permissions, DBAs can quickly identify sudden increases in the population of a Windows group that holds elevated privileges, through role membership.
What distinguishes Redgate Monitor Enterprise is its ability to track permissions data alongside performance and activity metrics. This combination establishes baselines for server and user activity, helping DBAs identify anomalies. For instance, Redgate Monitor can establish baselines for metrics relating to query performance (execution times, waits), resource usage (CPU, IO, memory, waits), and workload volumes (user connections, batch requests per second, locking and latching statistics, etc.). Using these baselines, DBAs can compare current behavior to historical patterns. If a DBA observes a suspicious “out of hours” activity spike on tables containing sensitive or controlled data, for example, Redgate Monitor enables immediate investigation. The DBA can review activity patterns, correlate them with any recent permission changes, and initiate a thorough audit to mitigate potential risks.
High availability monitoring
We all understand the importance of ensuring that our database instances are always running and available. High availability features for Microsoft SQL Server ensure they remain accessible even if a service goes offline. An issue that often gets less consideration is the availability of your monitoring solution. If the servers that are running the monitoring solution fail, there will be a period where metrics are not being tracked, so you risk missing performance bottlenecks or unauthorized access attempts.
To address this, Redgate Monitor Enterprise supports native high availability for both its core monitoring service (data collection) and its web service (data visualization). You can configure active/passive base monitoring services, or active/passive base monitor-web service pairs, with automatic failover if any one of these components fails.
Only a single base monitoring service at a time writes its results to the monitoring repository and if its ‘heartbeat’ stops then a passive standby immediately takes over and an alert is raised for the failover event. By mirroring the principles of SQL Server’s HA features, Redgate Monitor Enterprise provides resilient monitoring that ensures continuous surveillance of the availability, security and performance of your Microsoft SQL Server environments.
Integrations with Redgate Monitor Enterprise
One standout feature of Redgate Monitor Enterprise is its extensibility. Many monitoring tools restrict how you can use the data they collect, allowing access only through their standard dashboards and a set of pre-defined reports. Redgate Monitor Enterprise extends this access by making its monitoring data available through a set of APIs, so that applications can use the data within the monitoring repository. Third-party applications or custom-built in-house solutions can consume the data, analyzing and presenting it in ways that best suit the requirements of the various teams within your organization.
You can, for example, build custom dashboards for management oversight of key performance and security metrics. Or you could integrate monitoring data into incident management and ticketing systems, automatically linking database activity, security and performance metrics to incident reports. The integration possibilities are limited only by the solutions you want to integrate with.
Scaling your database monitoring and incident management
You can read more about this topic here, in the Redgate whitepaper ‘An Integrated Approach to Enterprise Database Monitoring and Incident Management‘.
The whole solution
With Redgate Monitor Enterprise, you have a highly available and integrated monitoring solution that can centrally track security, performance and health metrics for your whole database estate, and present all the data in a single dashboard.
You can manage user roles and permissions and retain oversight of who has access to what. You can track database and instance configuration settings, ensuring compliance with pre-defined or custom auditing templates, which you can export for review by auditors. Native High Availability monitoring will keep the monitoring solution up and running, even in the event of a hardware failure of the server hosting the monitoring solution. With the extensibility options available through the API, your company can gather data from the monitored environment and use it where and how it needs it.
With Redgate Monitor, organizations can ensure continuous performance and security monitoring through a unified approach. This not only helps in identifying and mitigating potential risks but also streamlines compliance and auditing processes, with a solution that enhances both the stability and security of your database estate.Data is the lifeblood of businesses all over the world, from the smallest startup to the largest enterprise. Making sure that it’s available when you need it, secured for authorized use, and recoverable from faults is vital to operating data platforms, no matter where your business is on its cloud journey. This can only be achieved by putting the right data into the hands of the right people, in a timely way, to make the right decisions about how to manage that platform effectively.
With its support for availability, security and recoverability, Redgate Monitor is a key tool for operational, development, and transformation teams working with data.
Three steps to cloud data platform
The journey to adopting a cloud-first approach to data platform in the cloud typically comprises three steps for most businesses – migrate, optimize, and modernize. This approach helps businesses to minimize risk and get the most value from their cloud deployments.
Migrate – it’s not just technology
The migration of data and databases from on-premises systems to cloud is relatively trivial, especially when doing a ‘lift and shift’ to virtual machines in AWS, Azure, or GCP. However, it’s also very easy to get it wrong because of the subtle differences in the way cloud works. Performing due diligence through discovery and analysis of the existing environment to understand workload requirements, seasonality, and dependencies allows technical teams to select the right migration pathway and remove blockers.
A very common challenge with ‘lift and shift’ is the cost implication for organizations as they move their on-premises configuration to the cloud. While infrastructure as a service (IaaS) is largely the same operational model as on-premises, the cost model is often radically different. Whereas on-premises we would size infrastructure for a three-to-five-year lifecycle, and build in capacity to grow, in the cloud we need to pay for all resources we allocate. It’s important to adjust the organization’s mindset to account for the flexibility and on-demand nature of resource availability the cloud provides. Being able to identify consistent resource use, and when and where usage spikes, becomes very important when sizing the cloud infrastructure that supports migrated workloads.
The benefits of understanding workload seasonality in the migration scenario include the ability to minimize excess resource allocation for infrastructure, and as a result to optimize spend. This also gives organizations the ability to leverage offers from cloud providers (such as compute or instance savings plans for resource they know will be used), and take advantage of deeper discounts over multi-year commitments.
Optimize – price performance is your KPI
Database workload optimization in the cloud becomes a key part of the way the database team operates. Switching from a reactive to a proactive stance is key to making a successful transition to the cloud, not only technically but also from a cost control perspective.
In the case of a ‘lift and shift’ to IaaS, there are benefits from moving to a platform as a service (PaaS) option. Moving from SQL Server on EC2 virtual machines to RDS for SQL Server, for example, can greatly simply the work of operational teams without the need to re-engineer databases. This will allow the operations team to focus on managing the database rather than the complexities of the infrastructure.
Irrespective of whether you’re running IaaS or PaaS, there needs to be a focus on workload performance efficiency. This isn’t just a case of making user interactions with the platform smoother; it has a tangible impact on operating costs. This FinOps approach, where operational and development teams take increased ownership of cost and cost control, means that running costs are optimized as part of daily activities.
Taking this a step further and shifting database observability left into the development cycle also makes it possible to set cost as a release metric for development work. Being able to gauge the impact of new or revised code to see if it increases resource usage allows us to identify and prevent unexpected cost increases before they reach production. Being able to identify an 8% increase in resource consumption and extrapolate that to the impact it will have on cost and resource usage in production is vital for preventing an unexpected bill at the end of the month.
Modernize – agility, flexibility, responsiveness
The final stage in the migration to cloud-native is the modernization of the data platform. In the context of database systems, this represents the adoption of vendor-managed database solutions such as Azure SQL Database, Amazon Aurora for PostgreSQL, and Google Cloud SQL.
Many organizations are looking at ways to optimize their budgets, and an increasing number are looking at migrating from a proprietary platform such as Oracle or SQL Server to PostgreSQL. Having a single database observability solution in place helps the technical teams performing this modernization deliver a successful outcome more quickly, by giving them the ability to see side-by-side resource consumption for the same workload. This also builds confidence with key stakeholders that the new platform will meet their needs, by presenting them with facts and the data supporting them.
Another facet of the modernization to a managed cloud database platform such as Amazon Aurora for PostgreSQL is the ability to leverage built-in scalability features. Modern serverless capabilities in these platforms allow them to flex dynamically to optimize resource use, meaning that these platforms can scale with the workloads they run. This isn’t always the case with older proprietary solutions, which run in a traditional IaaS model that requires far more management, planning, and disruption to flex with the needs of the organization and workload.
Database observability – optimizing cloud operations
Key to operating workloads in the cloud is putting the right information into the hands of the right people, at the right time, to allow them to make the right decisions. Having the right database observability solution in place to facilitate this is vital. A lack of visibility into the data platform can result in performance and availability issues taking longer to recover from, as well as businesses incurring unexpected costs.
Redgate Monitor provides broad coverage over the most frequently-used database engines, including SQL Server, Oracle, and Postgres, whether you’re running a hybrid, single, or multi-cloud infrastructure. It gives teams across the business visibility into key metrics, helping them proactively optimize workload performance and control costs before they become a problem. All of this in a single pane of glass that can be used by operations staff, development teams, helpdesk, or even product owners within the business.
As well as helping key stakeholders self-serve operational insight, broadening visibility to those outside of the traditional IT function helps build trust in the platform, whether that’s empowering business product owners, power users and advocates, or giving senior leaders on-demand visibility to service status without needing to ask someone for a report. This expansive use of database observability builds a culture of collaborative operational excellence which fosters trust and improves data platform outcomes.
If you want to see just how Redgate Monitor can help meet your database observability needs in the cloud, you can find more in-depth information at the links below: